Dashboard overview
The Dashboard is your home screen — a live snapshot of call quality across your team. It refreshes automatically (every ~15 seconds).
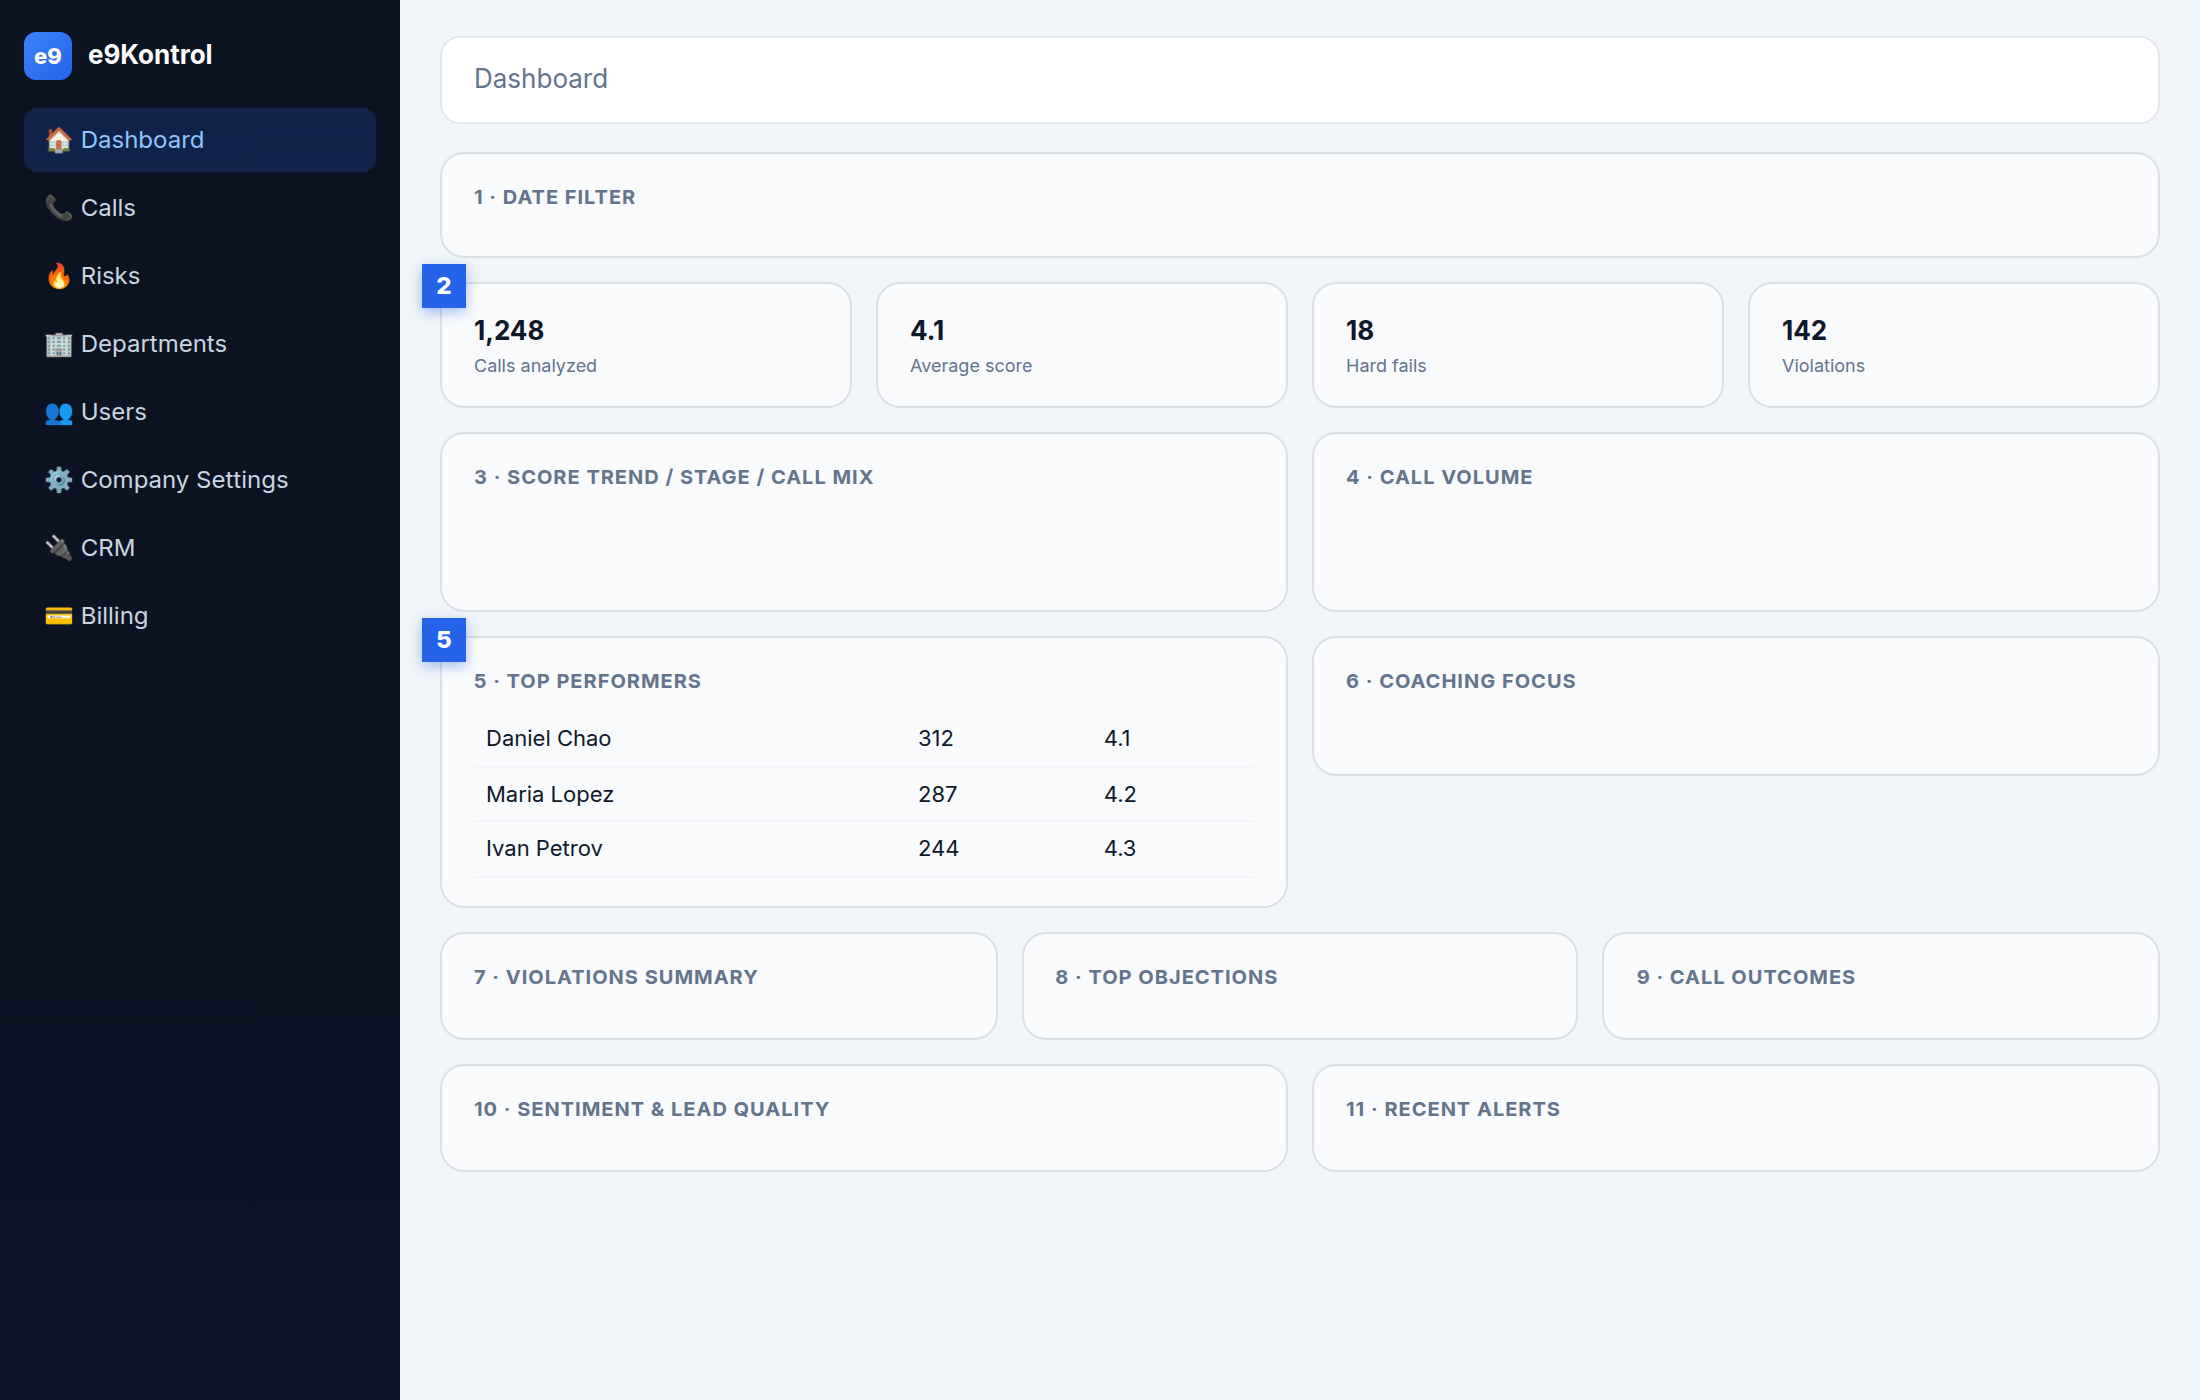
The 13 widgets
| # | Widget | What it shows |
|---|---|---|
| 1 | Date filter | Pick the period (today, week, month, custom). |
| 2 | KPI cards | Calls analyzed, average score, hard fails, violations. |
| 3 | Charts | Score trend, stage performance, call mix. |
| 4 | Call volume | How many calls were analyzed over time. |
| 5 | Top performers | Your best agents by score. |
| 6 | Coaching focus | Agents who need coaching most. |
| 7 | Violations summary | The most common violations. |
| 8 | Top objections | The objections your team faces most. |
| 9 | Call outcomes | The distribution of outcomes. |
| 10 | Sentiment & lead quality | Client mood and lead quality. |
| 11 | Recent alerts | The latest hard-fail and low-score alerts. |
How to use it
- Start with the KPI cards — the four numbers that matter most.
- Use Top performers to reinforce, and Coaching focus to find who needs help.
- Watch Recent alerts to catch problems as they happen.
tip
Everything on the dashboard responds to the date filter — change the period and every widget updates.